Guardianship Authority
Presidency of the
Council of Ministers
Lebanon serves as an entry point to the regional market through its liberal trade regime with an export-oriented economic strategy. Local companies looking to expand their exports can tap into a market of around 900 million people capitalizing on Lebanon’s low tariff rates which range between 0 and 5 for around 75% of goods.
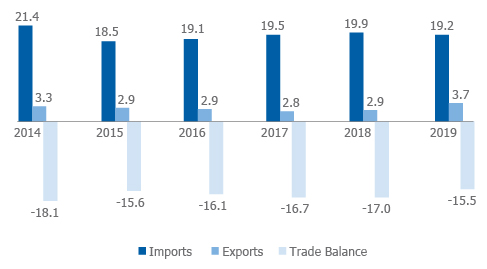
Furthermore, exporters can benefit from the multiple trade agreements that Lebanon is signatory to, including the Greater Arab Free Trade Area (GAFTA), Euro-Mediterranean Association Agreement and the European Free Trade Association (EFTA). Nonetheless, Lebanon’s trade balance recorded a deficit of USD 15.5 billion in 2019, down from USD 17 billion in 2018 due to a 4% decrease in total imports, mostly affected by the Syrian crisis and increasing regional competition.
LEBANON’S TRADE BALANCE (Billion USD | 2014-2019)

Source: Central Bank of Lebanon
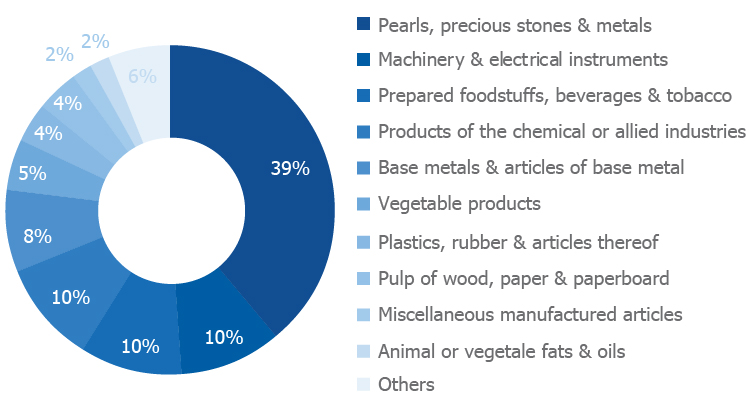
In 2019, Lebanese exports of goods reached USD 3.7 billion, up 26% from USD 2.9 billion in 2018. Major exports accounting for around 60% of total exports included pearls, precious stones & metals (39% of total exports), machinery & electrical equipment (10%) and chemical products (10%).
LEBANESE EXPORTS OF GOODS COMPOSITION (% Share | 2019)

Source: Lebanese Customs
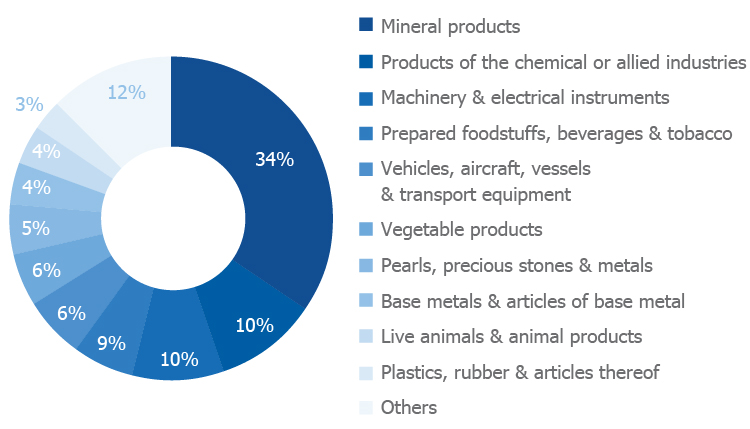
Lebanese imports fell from USD 19.6 billion in 2018 to USD 19.2 billion in 2019 with a reduction in spending resulting from the 17th of October events and inability to import raw materials. Major imports accounting for more than 50% of total imports included mineral products (34%), chemical products (10%) and machinery & electrical equipment (9%).
LEBANESE IMPORTS OF GOODS COMPOSITION (% Share | 2019)

Source: Lebanese Customs
Lebanon’s top export partners in 2019 included Switzerland with 28% of total exports, followed by UAE (12%), Saudi Arabia (7%), Syria (5%) and Iraq (4%). Arab countries remained Lebanon’s most important overall market, receiving around 41% of total Lebanese exports, followed by the EU, accounting for 11% of total exports.
MAIN DESTINATION OF EXPORTSED GOODS (% Share of Total Exports | 2019)
|
Country |
% |
Top Exported Products |
| Switzerland |
28 |
Pearls, precious stones and metals, Prepared foodstuffs, beverages and tobacco; Optical, photographic, medical and musical instruments; Pulp of wood; paper and paperboard; Textiles and textile articles |
| United Arab Emirates |
12 |
Pearls, precious stones and metals; Products of the chemical or allied industries; Prepared foodstuffs; beverages and tobacco; Machinery and electrical instruments; Vegetable products |
| Saudi Arabia |
7 |
Prepared foodstuffs, beverages and tobacco; Products of the chemical or allied industries; Vegetable products; Machinery and electrical instruments; Pulp of wood, paper and paperboard |
| Syrian Arab Republic |
5 |
Plastics and rubber; Mineral products; Machinery and electrical instruments; Vegetable products; Products of the chemical or allied industries |
| Iraq |
4 |
Machinery and electrical instruments; Products of the chemical or allied industries; Prepared foodstuffs, beverages and tobacco; Pulp of wood, paper and paperboard; Plastics and rubber |
Source: Lebanese Customs
Lebanon’s top import partners in 2019 included the USA with 9% of the total import share, followed by China (8%), Greece (7%), Russia (7%) and Italy (7%). In terms of markets, the EU constituted Lebanon’s main source of imports or 40% of total imports.
MAIN ORIGIN OF IMPORTED GOODS (% Share of Total Imports | 2019)
|
Country |
% |
Top Imported Products |
| United States |
9 |
Mineral products; Vehicles, aircraft, vessels and transport equipment; Products of the chemical or allied industries; Machinery and electrical instruments; Vegetable products |
| China |
8 |
Machinery and electrical instruments; Textiles and textile articles; Miscellaneous manufactured articles; Base metals and articles of base metal; Plastics, articles thereof and rubber |
| Greece |
7 |
Mineral products; Products of the chemical or allied industries; Prepared foodstuffs, beverages and tobacco; Base metals and articles of base metal; Plastics and rubber |
| Russia |
7 |
Mineral products; Vegetable products; Base metals and articles of base metal; Animal or vegetable fats and oils; Wood and articles of wood, wood charcoal and cork |
| Italy |
7 |
Mineral products; Machinery and electrical instruments; Products of the chemical or allied industries; Prepared foodstuffs, beverages and tobacco; Pearls, precious stones and metals |
Source: Lebanese Customs